Research Article - Archives of Clinical and Experimental Surgery (2023)
Does Obesity Affect Peri-operative and Post-operative Outcomes in Urological Oncological Surgeries?
Skandh Bhatia1*, K Veena L Karanth1 and Padmaraj Hegde22Department of Urology, Kasturba Medical College and Hospital, Manipal, India
Skandh Bhatia, Department of General Surgery, Kasturba Medical College and Hospital, Manipal, India, Email: skandhbhatia4@gmail.com
Received: 24-May-2023, Manuscript No. EJMACES-23-99933; Editor assigned: 26-May-2023, Pre QC No. EJMACES-23-99933 (PQ); Reviewed: 12-Jun-2023, QC No. EJMACES-23-99933; Revised: 19-Jun-2023, Manuscript No. EJMACES-23-99933 (R); Published: 28-Jun-2023
Abstract
Background: Obesity has a lengthy and well-established track record as a problematic health condition. Obesity affects not just the post-operative outcomes but also augments the severity of the disease to be tackled in the first place. As there is a dearth of research on the topic of the impact of obesity on peri-operative and post-operative outcomes in uro-oncological procedures, the present study aims to fill that void, with a focus on the Asian population.
Methods: A single centre prospective observational study which was conducted in the Department of Urology, Kasturba Medical College and Hospital, Manipal, on all patients undergoing surgery for urological malignancy from February 2021 to October 2022. A structured proforma was used for data collection.
Conclusions: Our findings suggest that patients with a BMI (Body Mass Index) in excess of the normal range are at a higher risk for complications after uro-oncological surgeries; however, obesity itself should not be considered a contraindication for any urological intervention, as most such interventions in obese individuals have a decent outcome. We emphasize, however, the need for more multi-site studies with sizable samples to corroborate our findings.
Keywords
Uro-oncological surgeries; BMI; Obesity paradox
Introduction
In the annals of human experience, obesity has a lengthy and well-established track record as a problematic health condition. However, for a long time, it was not considered a sickness, which made it difficult for doctors to be fairly rewarded for their services and to successfully treat the condition. In 2013, the American Medical Association (AMA) declared obesity to be a disease, and in 2014, it pushed for patients to have access to all available evidence-based treatment options for obesity, including surgery. The obesogenic environment has rapidly disseminated, making it easier for individuals to eat more and less difficult for them to engage in physical activity, both of which contribute to the global increase in the incidence of overweight and obesity [1].
According to the World Health Organization, 1.3 billion people are overweight (defined as a Body Mass Index (BMI) between 25 and 30) and 600 million are obese [2]. The incidence of overweight and obesity has more than quadrupled over the past 40 years (having a BMI of 30 or higher) [3]. In addition, seven of the top 10 leading causes of death/physical impairment are connected to fat, including cancer and diabetes [4]. This indicates that obesity ranks high on the list of global health problems. The increased mortality associated with obesity and its associated disorders is well established [5,6]. Among them include hypertension, stroke, coronary artery disease, and type II diabetes mellitus. When the body mass index of an individual is more than 25 kg/m2, they are at increased risk of dying from any cause [7]. Patients with a body mass index outside of the recommended range of 22.5-25 kg/m2 have an increased risk of death due to vascular comorbidities.
The mechanisms that underlie adverse events following surgery in obese patients are less understood. Patients with obesity, especially those in the upper Body Mass Index (BMI) range, are at increased risk for metabolic dysfunction and immunosuppression after surgery due to underlying metabolic excess. There is a larger danger of issues arising in people who can’t handle the intense stress of an emergency procedure [8-10]. The prevalence of surgical site infections and other infectious sequelae has led many to conclude that obesity is a major cause of post-operative morbidity and mortality [11]. People who are overweight are more likely to develop Surgical Site Infections (SSI) due to tissue hypoperfusion (subcutaneous adipose tissue), which puts them at risk for ischemia/ necrosis and insufficient neutrophil oxidative killing. Reduced oxygen tensions in fatty tissues, an increase in the tissue mass-to-capillary ratio, and an increase in the wound’s total surface area are all pathogenic processes (and thus a larger area to become susceptible to infection, greater oxygen demand, and a larger dead space with a closed incision and a larger wound fluid volume). Many of these issues may be caused by an oxygen supply-demand mismatch in the body’s tissues. As there is a dearth of research on the topic of the impact of obesity on peri-operative and post-operative outcomes in uro-oncological procedures, the present study aims to fill that void, with a focus on the Asian population.
Methods
This study was conducted in the Department of Urology, Kasturba Medical College and Hospital, Manipal.
Type of study
Single centre prospective observational study.
Study period
18/12/2020 to 12/10/2022
Inclusion criteria
Consenting patient undergoing surgery for
• Malignant Neoplasm of Penis
• Malignant Neoplasm of Prostate
• Malignant Neoplasm of Testis
• Malignant Neoplasm of Kidney, Renal Pelvis and Ureter
• Malignant Neoplasm of Bladder
• Malignant Neoplasm of Unspecified Urogenital organs where point of origin could not be identified.
Exclusion criteria
• Patients below 18 years of age.
• Patients unfit for surgery.
Data collection tool: Proforma.
Budget: No funding was required.
Ethical issues: The study had been approved in advance by the institution’s ethics board.
No Ethical concerns were expected as study was observational.
Procedure
• Institutional Ethics Committee (IEC) clearance was requested in advance.
• All participants meeting the study’s eligibility criteria provided written informed permission before enrolment.
• Information from participants was gathered using a proforma.
• The Body Mass Index was calculated as per the Quetelet’s formula:
BMI=Wt.(kgs)/Ht.2(Mts)
• The patients were grouped as obese and non-obese based on the analogue for Asian population.
• Data comparison was done using Multi-variant regression analysis to reach conclusion.
Table 1 shows classification of Patients based on Body Mass Index (BMI).
| Category | Body Mass Index (BMI) in Kg/m2 |
|---|---|
| Under weight | <18.5 |
| Normal weight | 18.5-22.9 |
| Over weight | 23-24.9 |
| Obese (Class 1) | 25.29.9 |
| Obese (Class 11) | >30 |
| Obese (Class 111) | ≥ 40 |
Results and Interpretation
Age distribution of patients under study
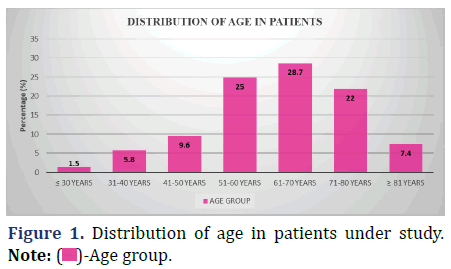
The following data shows the distribution of age in the patients under study (Figure 1 and Table 2).
| Age group | Patient count (N) |
Percentage (%) |
|---|---|---|
| ≤ 30 years | 2 | 1.5 |
| 31-40 years | 8 | 5.8 |
| 41-50 years | 13 | 9.6 |
| 51-60 years | 34 | 25 |
| 61-70 years | 39 | 28.7 |
| 71-80 years | 30 | 22 |
| ≥ 81 years | 10 | 7.4 |
| Total | 136 | 100 |
Inference: The respondents’ mean age was 62 years old, with a standard deviation of 13.1. The average discrepancy was 1.13.
Gender profile of patients under study
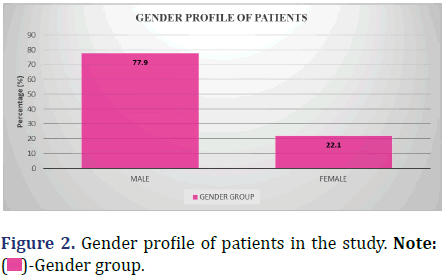
The following data shows the gender profile of the patients in the study (Figure 2 and Table 3).
| Gender | Patient count (N) |
Percentage (%) |
|---|---|---|
| Male | 106 | 77.9 |
| Female | 30 | 22.1 |
| Total | 136 | 100 |
Inference: Males represented the dominant group in this study, constituting 77.9% of the population under study, whereas females had 22.1% representation.
Categorisation of patients into obese and non- obese categories based on measurement of BMI
Patients were classified as Obese or Non-Obese based on their Body Mass Index (BMI), as stated in the Table 1. Body Mass Index (BMI) values of 25.0++ were used to draw the boundary between the Obese (≥ 25) and Non- obese (<25) categories (Figure 3 and Table 4).
| Category | Patient count (N=136) |
Mean BMI (Kg/m2) |
Percentage (%) |
|---|---|---|---|
| Non-obese (BMI <25) | 75 | 21.9 ± 2.2 | 55.1 |
| Obese (BMI ≥ 25) | 61 | 28.2 ± 2.0 | 44.9 |
Inference: The average BMI of patients classified as ‘’not obese’’ was 21.9 ± 2.2 Kg/m2 (standard error included) 0.25 standard deviation mean error. Patients who were classified as obese had a mean BMI of 28.2 ± 2.0 Kg/m2, according to the standard deviation (std). The incorrect average was 0.26.
Study waist circumference profile between obese and non-obese categories based on BMI of patients
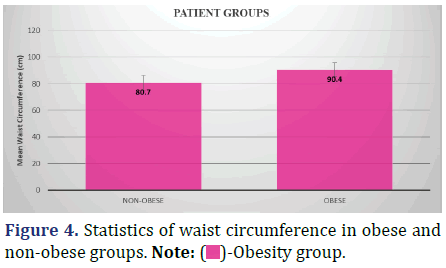
The following data shows statistics of waist circumference of the patient population in the two groups, namely Obese and Non-obese (++ based on BMI (Body Mass Index) observations) (Figure 4 and Table 5).
| Category | Mean waist circumference (cm) |
Kruskal-wallis test P-Value |
|---|---|---|
| Non-obese (BMI <25) | 80.7 ± 5.40 (0.6) | 0.001 |
| Obese (BMI ≥ 25) | 90.4 ± 5.42 (0.7) |
Inference: The mean waist circumference of patients in the non-obese group was 80.7 cm ± 5.4 cm with std. error in mean of 0.6. In comparison, the waist circumference of patients in the obese group was 90.4 cm ± 5.4 cm with std. error in mean of 0.7. The Kruskal-Wallis P-Value of 0.001 (<0.5) shows that the difference in waist circumference distribution between the two groups is significant.
Comparison of percentage prevalence of comorbidities in obese and non-obese patient groups
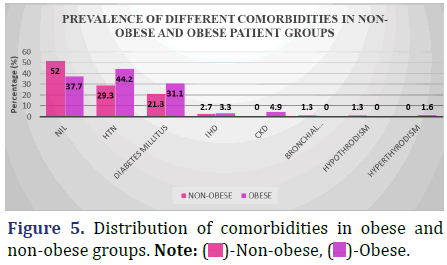
Compare the proportion of patients who have various comorbidities who are obese to those who are not fat in the data below (Figure 5 and Table 6).
| Comorbidity | Non-obese (N=75) |
Obese (N=61) |
Chi-Square P-Value |
|---|---|---|---|
| Nil | 39 (52%) | 23 (37.7%) | 0.15 |
| Htn | 22 (29.3%) | 27 (44.2%) | |
| Diabetes mellitus | 16 (21.3%) | 19 (31.1%) | |
| Ihd | 2 (2.7%) | 2 (3.3%) | |
| Ckd | 0 (0.0%) | 3 (4.9%) | |
| Bronchial asthma | 1 (1.3%) | 0 (0.0%) | |
| Hypothyroidism | 1 (1.3%) | 0 (0.0%) | |
| Hyperthyroidism | 0 (0.0%) | 1 (1.6%) |
Inference: The difference in the prevalence of comorbidities between the non-obese and obese groups was not statistically significant, with a Chi-Square Value (χ2) of 10.7 and a Chi-Square P-value of 0.15 (>0.05).
Carcinoma type prevalence in obese and non- obese patients
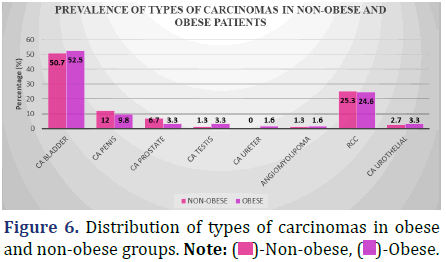
The following data shows the incidence of many types of carcinomas in both fat and non-obese people (Figure 6 and Table 7).
| Type of carcinoma | Non-obese (N=75) |
Obese (N=61) |
Chi-square P-Value |
|---|---|---|---|
| Ca bladder | 38 (50.7%) | 32 (52.5%) | 0.9 |
| Ca penis | 9 (12.0%) | 6 (9.8%) | |
| Ca prostate | 5 (6.7%) | 2 (3.3%) | |
| Ca testis | 1 (1.3%) | 2 (3.3%) | |
| Ca ureter | 0 (0.0%) | 1 (1.6%) | |
| Angiomyolipoma | 1 (1.3%) | 1 (1.6%) | |
| Rcc | 19 (25.3%) | 15 (24.6%) | |
| Ca urothelial | 2 (2.7%) | 2 (3.3%) |
Inference: With the Chi-Square Value (χ2) of 2.8 and Chi-Square P-value of 0.9 (>0.05), There was no statistically significant difference in the prevalence of any one form of carcinoma between the Non-obese and Obese groups.
Comparison of prevalence of lymph node metastasis between obese and non-obese patients
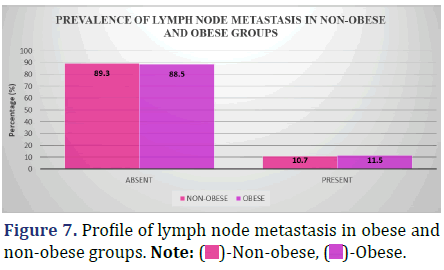
Lymph node metastasis incidence varies considerably between individuals who are overweight and those who are not; this is seen in Figure 7 and Table 8.
| Type of carcinoma | Non-obese (N=75) |
Obese (N=61) |
Chi-square P-Value |
|---|---|---|---|
| Absent | 67 (89.3%) | 54 (88.5%) | 0.88 |
| Present | 8 (10.7%) | 7 (11.5%) |
Inference: The Chi-Square Value (χ2) was 0.02 and the Chi-Square P-value was 0.88 (>0.05), indicating that there was no statistically significant difference in the frequency of lymph node metastasis between the non- obese and obese groups.
Comparison of operative time between obese and non-obese patients
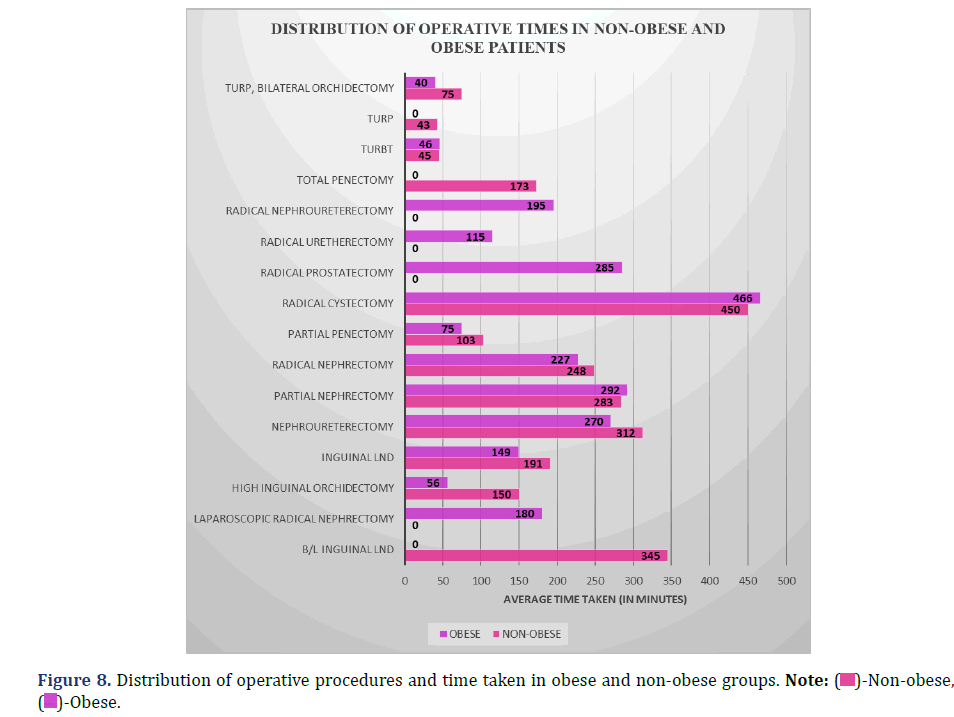
The following data compares the average amount of time spent on various surgical operations performed on obese and non-obese patients (Figure 8 and Table 9).
| Type of operative procedure | Non-obese (N=75) |
Obese (N=61) |
Kruskal -Wallis P-Value |
||
|---|---|---|---|---|---|
| Count (N) | Mean operative time (minutes) | Count (N) | Mean operative time (minutes) | ||
| B/l inguinal lnd | 1 | 345 | 0 | 0 | 0.92 |
| Laparoscopic radical nephrectomy | 0 | 0 | 1 | 180 | |
| High inguinal orchidectomy | 1 | 150 | 2 | 56 | |
| Inguinal lnd | 3 | 191 | 3 | 149 | |
| Nephroureterectomy | 2 | 312 | 1 | 270 | |
| Partial nephrectomy | 5 | 283 | 6 | 292 | |
| Radical nephrectomy | 15 | 248 | 9 | 227 | |
| Partial penectomy | 3 | 103 | 3 | 75 | |
| Radical cystectomy | 2 | 450 | 3 | 466 | |
| Radical prostatectomy | 0 | 0 | 1 | 285 | |
| Radical uretherectomy | 0 | 0 | 1 | 115 | |
| Radical nephroureterectomy | 0 | 0 | 1 | 195 | |
| Total penectomy | 2 | 173 | 0 | 0 | |
| Turbt | 36 | 45 | 29 | 46 | |
| Turp | 3 | 43 | 0 | 0 | |
| Turp, bilateral orchidectomy | 2 | 75 | 1 | 40 | |
Inference: The Kruskal-Wallis test indicated no statistically significant difference between the Non-obese and Obese groups in the distribution of operating times across different surgical procedures (P=0.92; >0.05).
Study of hypotension as a peri-operative complication (intra-op to 48 hrs post-op) between obese and non-obese patients
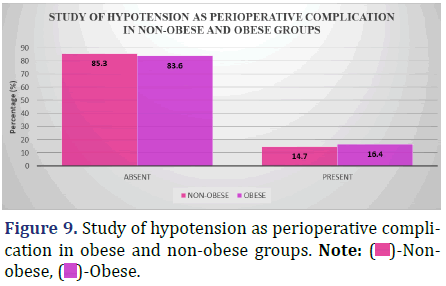
The accompanying graphic displays the incidence of hypotension in both obese and non-obese patients at various stages of the peri-operative period (from intra-operatively to 48 hours post-operatively) (Figure 9 and Table 10).
| Hypotension (present/absent) | Non-obese (N=75) |
Obese (N=61) |
Chi-square P-Value |
|---|---|---|---|
| Absent | 64 (85.3%) | 51 (83.6%) | 0.78 |
| Present | 11 (14.7%) | 10 (16.4%) |
Inference: There was no statistically significant difference in the incidence of Hypotension as a complication of surgery between the non-obese and obese groups (Chi-Square Value (χ2)=0.08, Chi-Square P-value=0.78 [>0.05]).
Study of bradycardia as a peri-operative complication (intra-op to 48 hrs post-op) between obese and non-obese patients
In the accompanying table, we can see how often patients who are overweight or obese get Bradycardia throughout the peri-operative period (from intra-operatively to 48 hours post-operatively) (Figure 10 and Table 11).
| Bradycardia (present/absent) | Non-obese (N=75) |
Obese (N=61) |
Chi-square P-Value |
|---|---|---|---|
| Absent | 74 (98.7%) | 59 (96.7%) | 0.44 |
| Present | 1 (1.3%) | 2 (3.3%) |
Inference: There was no statistically significant difference in the rate of Bradycardia as a complication of surgery between the non-obese and obese groups (Chi-Square Value (χ2)=0.59, Chi-Square P-value=0.44 (>0.05)).
Study of cardiac arrest as peri-operative complication (intra-op to 48 hrs post-op) between obese and non-obese patients
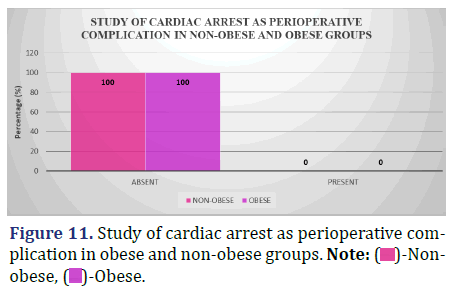
Compare the rates of cardiac arrest in obese and non- obese individuals throughout the peri-operative period (Intra-op to 48 hours Post-op) in the data below (Figure 11 and Table 12).
| Cardiac arrest (present/absent) | Non-obese (N=75) |
Obese (N=61) |
|---|---|---|
| Absent | 75 (100.0%) | 61 (100.0%) |
| Present | 0 (0%) | 0 (0%) |
Inference: Since neither the non-obese nor the obese groups had any patients who experienced cardiac arrest during surgery, no analysis was done.
Study of the need for blood transfusion as a peri-operative complication (intra-op to 48 hrs post-op) between obese and non-obese patients
The incidence of blood transfusion needs throughout the peri-operative period (intra-operatively to 48 hours post-operatively) for both obese and non-obese individuals is broken down below (Figure 12 and Table 13).
| Need for blood transfusion (present/absent) | Non-obese (N=75) |
Obese (N=61) |
Chi-square P-Value |
|---|---|---|---|
| Absent | 66 (88.0%) | 57 (93.4%) | 0.28 |
| Present | 9 (12.0%) | 4 (6.6%) |
Inference: With the Chi-Square Value (χ2) of 1.14 and Chi-Square P-value of 0.28 (>0.05), the difference in the distribution of the need for blood transfusion as a peri-operative complication between the non-obese and obese group was not significant.
Study of the surgical site infection as a post-operative complication (48 hrs post-op till discharge) between obese and non-obese patients
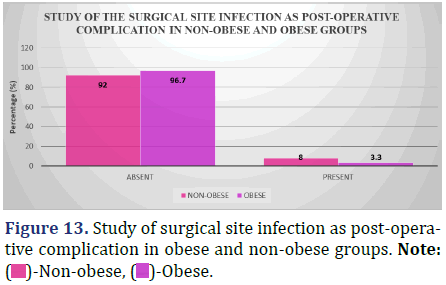
Infection at the surgical site is a common post-operative complication, and the accompanying table compares the rates of infection in obese and non-obese patients from the time of surgery (48 hours post-operatively) to the time of discharge (Figure 13 and Table 14).
| Surgical site infection (present/absent) | Non-obese | Obese | Chi-square |
|---|---|---|---|
| (N=75) | (N=61) | P-Value | |
| Absent | 69 (92%) | 59 (96.7%) | 0.25 |
| Present | 6 (8%) | 2 (3.3%) |
Inference: With the Chi-Square Value (χ2) of 1.34 and Chi-Square P-value of 0.25 (>0.05), There was no statistically significant difference in the proportion of patients in the non-obese and obese groups who developed a surgical site infection after surgery.
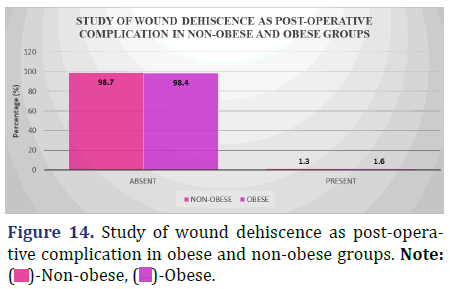
Complications of surgery in obese and non-obese patients: A study of wound dehiscence (from 48 hours post-op to discharge)
The following table compares the rates of wound dehiscence in obese and non-obese individuals from the time of surgery (48 hours post-op) to the time of discharge (Figure 14 and Table 15).
| Wound dehiscence (present/absent) | Non-obese (N=75) |
Obese (N=61) |
Chi-square P-Value |
|---|---|---|---|
| Absent | 74 (98.7%) | 60 (98.4%) | 0.88 |
| Present | 1 (1.3%) | 1 (1.6%) |
Inference: The distribution of wound dehiscence as a post-operative complication was different between the non-obese and the obese group, however the difference was not statistically significant (Chi-Square Value (χ2)=0.02 and Chi-Square P-value=0.88 (>0.05)).
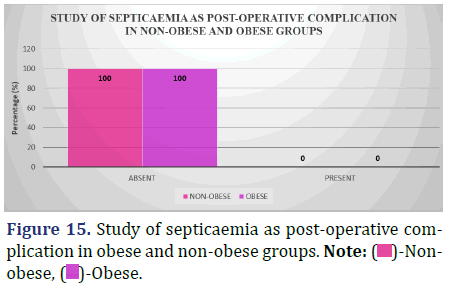
Study of septicaemia as a post-operative complication (48 hrs post-op till discharge) between obese and non-obese patients
The accompanying table compares the incidence of septicemia in obese and non-obese individuals from 48 hours post-operatively to patient discharge (Figure 15 and Table 16).
| Septicaemia (present/absent) | Non-obese (N=75) |
Obese (N=61) |
|---|---|---|
| Absent | 75 (100%) | 61 (100%) |
| Present | 0 (0.0%) | 0 (0.0%) |
Inference: Since neither the non-obese nor the obese groups had any patients who developed septicaemia post-operatively, no analysis was done.
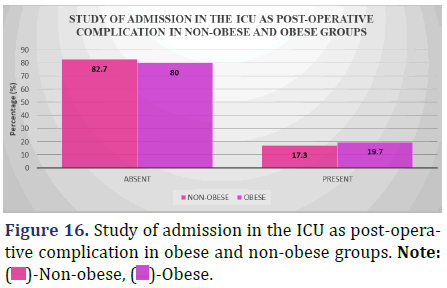
Study of Admission in the ICU as Post-Operative Complication (48 hrs post-op till discharge) between obese and non-obese patients
Surgical complications are a leading cause of Intensive Care Unit (ICU) admissions, and the accompanying chart compares the percentage of obese and non-obese patients who have these complications (from 48 hours post-op to patient release) (Figure 16 and Table 17).
| Admission in the ICU (present/absent) | Non-obese (N=75) |
Obese (N=61) |
Chi-square P-Value |
|---|---|---|---|
| Absent | 62 (82.7%) | 49 (80%) | 0.73 |
| Present | 13 (17.3%) | 12 (19.7%) |
Inference: With a Chi-Square Value (χ2) of 0.12 and a Chi-Square P-value of 0.73 (>0.05), there was no statistically significant difference between the non-obese and obese groups in the allocation of instances of admission in the ICU as post-operative complication.
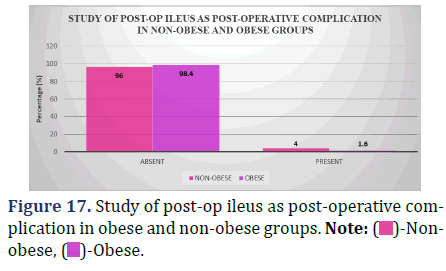
Study of post-op ileus as a post-operative complication (48 hrs post-op till discharge) between obese and non-obese patients
The incidence of post-op ileus, a complication that may occur between 48 hours after surgery and the time a patient is discharged, is broken down by body mass index in the data below (Figure 17 and Table 18).
| Post-op ileus (present/absent) | Non-obese (N=75) |
Obese (N=61) |
Chi-square P-Value |
|---|---|---|---|
| Absent | 72 (96%) | 60 (98.4%) | 0.42 |
| Present | 3 (4%) | 1 (1.6%) |
Inference: The distribution of instances of post-op ileus as a post-operative complication did not vary significantly between the non-obese and obese groups, with a Chi-Square Value (χ2) of 0.65 and a Chi-Square P-value of 0.42 (>0.05).
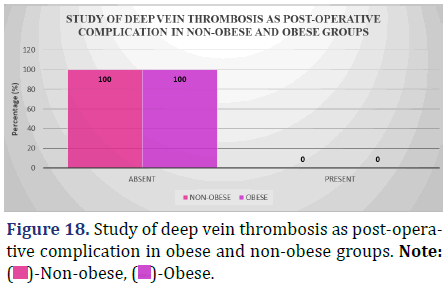
Study of deep vein thrombosis as post-operative complication (48 hrs post-op till discharge) between obese and non-obese patients
Both for obese and non-obese patients, the incidence of Deep Vein Thrombosis (DVT) after surgery (from 48 hours post-op till patient discharge) is shown in the data below (Figure 18 and Table 19).
| Deep vein thrombosis (present/absent) | Non-obese (N=75) |
Obese (N=61) |
|---|---|---|
| Absent | 75 (100%) | 61 (100%) |
| Present | 0 (0%) | 0 (0%) |
Inference: Following surgery, neither the non-obese nor the obese group experienced any cases of Deep Vein Thrombosis, hence there was no statistical analysis done in this regard.
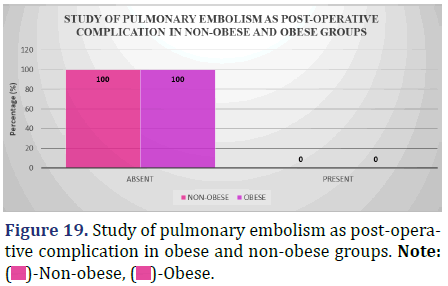
Study of pulmonary embolism as post-operative complication (48 hrs post-op till discharge) between obese and non-obese patients
Table showing the proportion of obese and non-obesity patients who experienced pulmonary embolism as a post-operative complication (from 48 hours post-op till patient discharge) (Figure 19 and Table 20).
| Pulmonary embolism (present/absent) | Non-obese (N=75) |
Obese (N=61) |
|---|---|---|
| Absent | 75 (100%) | 61 (100%) |
| Present | 0 (0%) | 0 (0%) |
Inference: Due to the lack of occurrences in either the non-obese or obese groups, there was no statistical analysis of Pulmonary Embolism as a post-operative complication between the two groups.
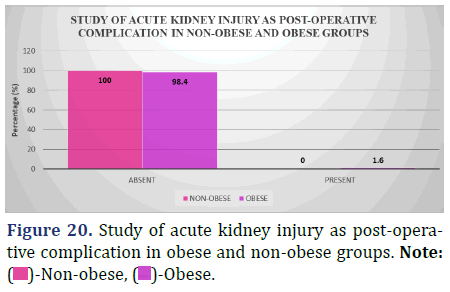
Study of acute kidney injury (requiring dialysis) as post-operative complication (48 hrs post-op till discharge) between obese and non-obese patients
Individuals who had surgery when overweight or obese had a higher risk of developing Acute Kidney Injury (Requiring Dialysis) than patients of normal weight (from 48 hours post-op to patient discharge) (Figure 20 and Table 21).
| Acute kidney injury (present/absent) | Non-obese (N=75) |
Obese (N=61) |
Chi-square P-value |
|---|---|---|---|
| Absent | 75 (100%) | 60 (98.4%) | 0.27 |
| Present | 0 (0%) | 1 (1.6%) |
Inference: With the Chi-Square Value (χ2) of 1.23 and Chi-Square P-value of 0.27 (>0.05), the difference in the distribution of cases of Acute Kidney Injury (requiring Dialysis) as post-operative complication between the non-obese and obese groups was not significant.
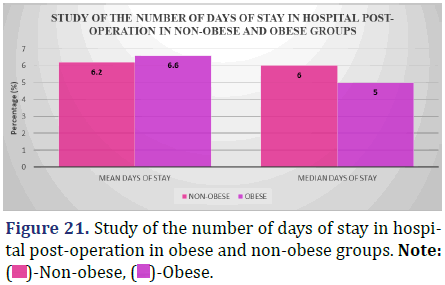
Study of the median number of days of stay in hospital post-operation between obese and non- obese patients
The following data shows a comparison of the typical length of post-operative hospital stays for people who are overweight or obese (Figure 21 and Table 22).
| Number of days of stay in hospital | Non-obese (N=75) |
Obese (N=61) |
Kruskal-wallis P-value |
|---|---|---|---|
| Mean (days) | 6.2 ± 3.16 | 6.6 ± 4.0 | 0.77 |
| Median (days) | 6.0 | 5.0 |
Inference: According to the results of a Kruskal-Wallis test, the distribution of post-operative hospital stays for the non-obese and obese groups were statistically identical (P=0.77, >0.05).
Comparison of final HPE and its Grade between obese and non-obese patients
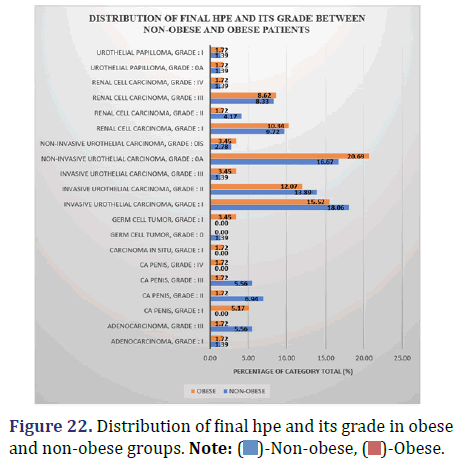
The following data compares the percentage of obese and non-obese patients who experienced each final HPE grade (Figure 22 and Table 23).
| Final HPE | Grade | Non-obese (N=75) |
Obese (N=61) |
Chi-square P-value |
|---|---|---|---|---|
| Adenocarcinoma | i | 1 | 1 | 0.68 |
| Adenocarcinoma | iii | 4 | 1 | |
| Ca penis | i | 0 | 3 | |
| Ca penis | ii | 5 | 1 | |
| Ca penis | iii | 4 | 1 | |
| Ca penis | iv | 0 | 1 | |
| Carcinoma in situ | i | 0 | 1 | |
| Germ cell tumor | 0 | 1 | 0 | |
| Germ cell tumor | i | 0 | 2 | |
| Invasive urothelial carcinoma | i | 13 | 9 | |
| Invasive urothelial carcinoma | ii | 10 | 7 | |
| Invasive urothelial carcinoma | iii | 1 | 2 | |
| Non-invasive urothelial carcinoma | 0 | 12 | 12 | |
| Non-invasive urothelial carcinoma | 0 | 2 | 2 | |
| Renal cell carcinoma | i | 7 | 6 | |
| Renal cell carcinoma | ii | 3 | 1 | |
| Renal cell carcinoma | iii | 6 | 5 | |
| Renal cell carcinoma | iv | 1 | 1 | |
| Urothelial papilloma | 0 | 1 | 1 | |
| Urothelial papilloma | i | 1 | 1 |
Inference: The Chi-Square (χ2) value of 15.7 and the Chi-Square test P-value of 0.68 (>0.05) demonstrate that there are no statistically significant differences in the distribution of final HPE and its grades between the non-obese and obese groups.
Discussion
Our study set out to compare the risk of peri-operative and post-operative problems between morbidly obese and non-morbidly obese patients undergoing urological cancer surgery.
Our sample group had a mean age of 62.2 years. Patients were primarily in their sixth (25%), seventh (28.7%), or eighth (22%). This study’s average participant age is in line with previous research. According to their studies, Meyer, et al discovered a mean age of 68.6 years [12], Mari, et al. found a mean age of 62 years [13], and Albisinni, et al. found a mean age of 68 years [14].
We discovered that there were 77.9% male participants, making the male to female sex ratio 3.53:1. In line with the findings of related research. Male to female ratios ranged from 4.35:1 (for Meyer, et al [12]) to 1.85:1 (for Mari, et al [13]) and 4.70:1 (for Albisinni, et al. [14]) (Table 24).
| Reference | Mean age | Male: Female |
|---|---|---|
| Meyer, et al. (12) | 68.6 years | 4.35:1 |
| Mari, et al. (13) | 62 years | 1.85:1 |
| Albisinni, et al. (14) | 68 years | 4.70:1 |
| Present study | 62.2 years | 3.53:1 |
Of the patients in our research, the prevalence of diabetes mellitus was higher among the obese (31.3%) than among the non-obese (21.3%). Although the proportion of co-morbidities was higher for the obese group, there was no statistically significant difference between the two groups.
It was shown that only 55.1% of patients had a healthy Body Mass Index (BMI), whereas 44.9% were obese (BMI 25 kg/m2). Body Mass Index (BMI) was 28.2 ± 2.0 Kg/m2 for the obese and 21.9 ± 2.2 Kg/m2 for the non- obese.
The average waist circumference of the obese patients was 90.4 ± 5.42 cm, whereas that of the non-obese patients was 80.7 ± 5.40 cm. Differences between the groups were statistically significant (p=0.001, p<0.05). This means that waist circumference can be a reliable indicator of obesity.
Urinary Bladder carcinoma (52.5% vs. 50.7%), followed by Renal cell carcinoma (24.6% vs. 25.3%), were the two most prevalent urological cancers in both groups. There was no evidence to suggest that one group was at a higher risk than the other for developing urological cancer (p=0.9, p>0.05).
Weight-related obesity was associated with an increased percentage of lymph node metastases (11.5 percent vs. 0%). There was a 10.7 percent increase. But the numbers indicated that neither group was significantly different from the other (p=0.88, p>0.05).
Radical cystectomy was the surgical procedure with the longest operative duration in both groups (Obese vs. Non-obese, 466 vs. 450 min), followed by partial nephrectomy (Obese vs. Non-obese, 292 vs. 283 min). Both procedures took longer in the obese group, but in the non-obesity group, operational times were longer for procedures such inguinal lymph node dissection, radical nephrectomy, etc. As a result, there was no appreciable variation in total operative time between the two groups (p=0.92, p<0.05).
In the group of people who did not have obesity, the rate of prostate cancer was 6.7%, but in the obese group, it was only 3.3%. This agrees with the obesity paradox. Due to the lesser number of patients with carcinoma prostate, we cannot draw any firm conclusions on whether or not obesity protects against carcinoma prostate.
The incidence of hypotension increased with obesity among both obese and non-obese patients who are undergoing surgery (16.4% in obese vs. 14.7% in non- obese). No statistically significant difference was seen between the two groups (p=0.78, p>0.05)
Obese patients had a higher percentage of intra-operative bradycardia than non-obese patients (3.3% vs. 1.3%). No statistically significant distinction could be made between the two groups (p=0.44, p>0.05).
None of the patients in either group experienced a cardiac arrest during surgery or later on from complications such sepsis, DVT and embolisms (Obese and Normal Weight).
During the peri-operative phase, lesser percentage of non-obese patients required blood transfusion compared to the obese (12% vs. 6.6%). However, no statistically significant distinction could be detected between the two groups (p=0.28, p>0.05).
After surgery, non-obese patients had a higher percentage of surgical site infections than the obese (8% vs. 3.3%). No statistically significant distinction could be detected between the two groups (p=0.25, p>0.05).
In individuals who were obese, the rate of wound dehiscence after surgery was much higher than in those who were not obese (1.6% vs. 1.3%). No statistically significant distinction could be made between the two groups (p=0.88, p>0.05).
Post-operative complications leading to intensive care unit admission were more common among the obese than among the lean (19.7% vs. 17.3%). We found no evidence of a major gap between the two groups (p=0.73, p>0.05).
Non-obese people were more likely than obese people to develop post-op ileus, a surgical complication (4% vs. 1.6%). No statistically significant distinction could be detected between the two groups (p=0.42, p>0.05).
Acute renal injury was more likely in the obese than in the non-obese following surgery, which was one of the several complications that the obese experienced (1.6% vs. 0%). No statistically significant differences were found between the two groups (p=0.27, p>0.05).
Higher-grade carcinomas were more common among the non-obese group compared to the obese population. This difference, however, was shown to be statistically unimportant (p=0.68, p>0.05).
Hospital stays for patients who were not obese averaged 6.2 days, whereas stays for patients who were obese averaged 6.6 days. That’s consistent with what we see, which is contrary to the common belief that obese individuals have longer hospital stays.
Conclusion
Our study seeks to fill a gap in the literature by investigating the relationship between BMI and the risk of complications during and after urological oncology operations in the Indian population.
Many types of urological cancer have been linked to obesity for a long time, and this association has been mostly negative. This research looked at how being overweight affects patients during and after procedures pertaining to urological oncology. Urological malignancies and lymph node metastases were somewhat more common in the obese patients, but this difference was not statistically significant. Operative duration for some uro-oncological surgeries like radical cystectomy and partial nephrectomy was more in obese patients. In contrast, a longer operative time was reported in other urological oncological surgeries in non-obese patients indicating the difference to be non-significant. Peri-operative complications such as hypotension and bradycardia were reported more amongst obese patients, while the requirement for blood transfusion was more in non-obese patients. Post-operative complications like wound dehiscence, ICU admission, acute kidney injury, and longer post-operative hospital stay were more prevalent in obese patients. While nonobese individuals had a lower incidence of surgical site infections, post-op ileus, and higher-grade carcinomas on final HPE, obese patients had a greater incidence of all three. However, no statistically significant difference was found in peri-operative or post-operative complications between the two groups.
Our findings suggest that patients with a BMI in excess of the normal range are at a higher risk for complications after uro-oncological surgeries; however, obesity itself should not be considered a contraindication for any urological intervention, as most such interventions in obese individuals have a decent outcome. We emphasize, however, the need for more multi-site studies with sizable samples to corroborate our findings.
Limitations
• Smaller sample size due to which not all urological malignancies could be represented to draw an effective conclusion for each, and the analytical power of the study was restricted.
• These population-based analyses could not account for potential confounding variables, such as patients’ performance status, ASA status, variations in laboratory results, and opioid usage, as well as neoadjuvant androgen deprivation and preoperative irradiation.
• As the post-operative complications were included only up until the point of discharge, complications occurring after discharge were not accounted for.
• Histological grading/differentiation has not been included due to a lack of standardized reporting system.
Conflict of Interest
No conflict of interest.
Funding
None to declare.
References
- Apovian CM. Obesity: Definition, comorbidities, causes, and burden. Am J Manag Care 2016;22(7 Suppl):s176-185.
[Google Scholar] [Pubmed]
- WHO, Obesity and overweight Fact sheet N°311. Geneva: World Health Organization, 2015.
- NCD Risk Factor Collaboration. Trends in adult body-mass index in 200 countries from 1975 to 2014: A pooled analysis of 1698 population-based measurement studies with 19.2 million participants. Lancet 2016;387(10026):1377-1396.
[Crossref] [Google Scholar] [Pubmed]
- National Center for Health Statistics US. Health, United States, 2015: With special feature on racial and ethnic health disparities.
- National Institutes of Health. Clinical guidelines for the identification, evaluation, and treatment of overweight and obesity in adults-the evidence report. Obes Res 1998;6(2):51S-209S.
[Crossref] [Google Scholar] [Pubmed]
- Mourelo R, Kaidar-Person O, Fajnwaks P, Roa PE, Pinto D, Szomstein S, et al. Hemorrhagic and thromboembolic complications after bariatric surgery in patients receiving chronic anticoagulation therapy. Obes Surg 2008;18:167-170.
[Crossref] [Google Scholar] [Pubmed]
- Prospective Studies Collaboration. Body-mass index and cause-specific mortality in 900 000 adults: Collaborative analyses of 57 prospective studies. Lancet 2009;373(9669):1083-1096.
[Crossref] [Google Scholar] [Pubmed]
- Mullen JT, Davenport DL, Hutter MM, Hosokawa PW, Henderson WG, Khuri SF, et al. Impact of body mass index on perioperative outcomes in patients undergoing major intra-abdominal cancer surgery. Ann Surg Oncol 2008;15:2164-2172.
[Crossref] [Google Scholar] [Pubmed]
- Hotamisligil GS. Inflammation and metabolic disorders. Nature 2006;444(7121):860-867.
[Crossref] [Google Scholar] [Pubmed]
- Gil A, Aguilera CM, Gil-Campos M, Canete R. Altered signalling and gene expression associated with the immune system and the inflammatory response in obesity. Br J Nutr 2007;98(S1):S121-126.
[Crossref] [Google Scholar] [Pubmed]
- Dindo D, Muller MK, Weber M, Clavien PA. Obesity in general elective surgery. Lancet 2003;361(9374):2032-2035.
[Crossref] [Google Scholar] [Pubmed]
- Mari A, Antonelli A, Bertolo R, Bianchi G, Borghesi M, Ficarra V, et al. Predictive factors of overall and major postoperative complications after partial nephrectomy: results from a multicenter prospective study (The RECORd 1 project). Eur J Surg Oncol 2017;43(4):823-830.
[Crossref] [Google Scholar] [Pubmed]
- Meyer CP, Rios Diaz AJ, Dalela D, Hanske J, Pucheril D, Schmid M, et al. Wound dehiscence in a sample of 1 776 cystectomies: Identification of predictors and implications for outcomes. BJU Int 2016;117(6B):E95-E101.
[Crossref] [Google Scholar] [Pubmed]
- Albisinni S, Oderda M, Fossion L, Varca V, Rassweiler J, Cathelineau X, et al. The morbidity of laparoscopic radical cystectomy: analysis of postoperative complications in a multicenter cohort by the European Association of Urology (EAU)-Section of Uro-Technology. World J Urol 2016;34:149-156.
[Crossref] [Google Scholar] [Pubmed]
Copyright: © 2023 The Authors. This is an open access article under the terms of the Creative Commons Attribution Non Commercial Share Alike 4.0 (https://creativecommons.org/licenses/by-nc-sa/4.0/). This is an open access article distributed under the terms of the Creative Commons Attribution License, which permits unrestricted use, distribution, and reproduction in any medium, provided the original work is properly cited.




 )-Age group.

 )-Obesity group
 )-Obese.


 )-Non-obese, (
 )-Obese.